
domingo, 6 de maio de 2018
sábado, 12 de março de 2016

domingo, 6 de dezembro de 2015

terça-feira, 17 de novembro de 2015
Monitoring Cassandra Permissions with Tableau

Cassandra permissions are easy to manage and very similar to a relational database: you can grant alter, authorize, create, drop modify or select to any user to any table.
Also, to verify a permission, you just have to query the permission table.
SELECT * FROM SYSTEM_AUTH.PERMISSIONS WHERE USERNAME = 'user1';
username | resource | permissions
----------+--------------------+--------------------------------------------------------------
user1 | data/demo1 | {'ALTER', 'AUTHORIZE', 'CREATE', 'DROP', 'MODIFY', 'SELECT'}
user1 | data/demo2/table25 | {'MODIFY'}
user1 | data/demo2/table29 | {'ALTER'}
user1 | data/demo2/table44 | {'ALTER', 'SELECT'}
user1 | data/demo2/table49 | {'SELECT'}
user1 | data/demo2/table7 | {'AUTHORIZE'}
user1 | data/demo3/table10 | {'MODIFY'}
user1 | data/demo3/table15 | {'ALTER'}
user1 | data/demo4/table13 | {'SELECT'}
user1 | data/demo4/table35 | {'AUTHORIZE'}
user1 | data/demo4/table38 | {'SELECT'}
user1 | data/demo5/table17 | {'DROP'}
user1 | data/demo6/table16 | {'ALTER'}
user1 | data/demo6/table30 | {'SELECT'}
user1 | data/demo6/table31 | {'AUTHORIZE', 'MODIFY'}
user1 | data/demo6/table37 | {'SELECT'}
(16 rows)
But, visually, it may not be the best choice.
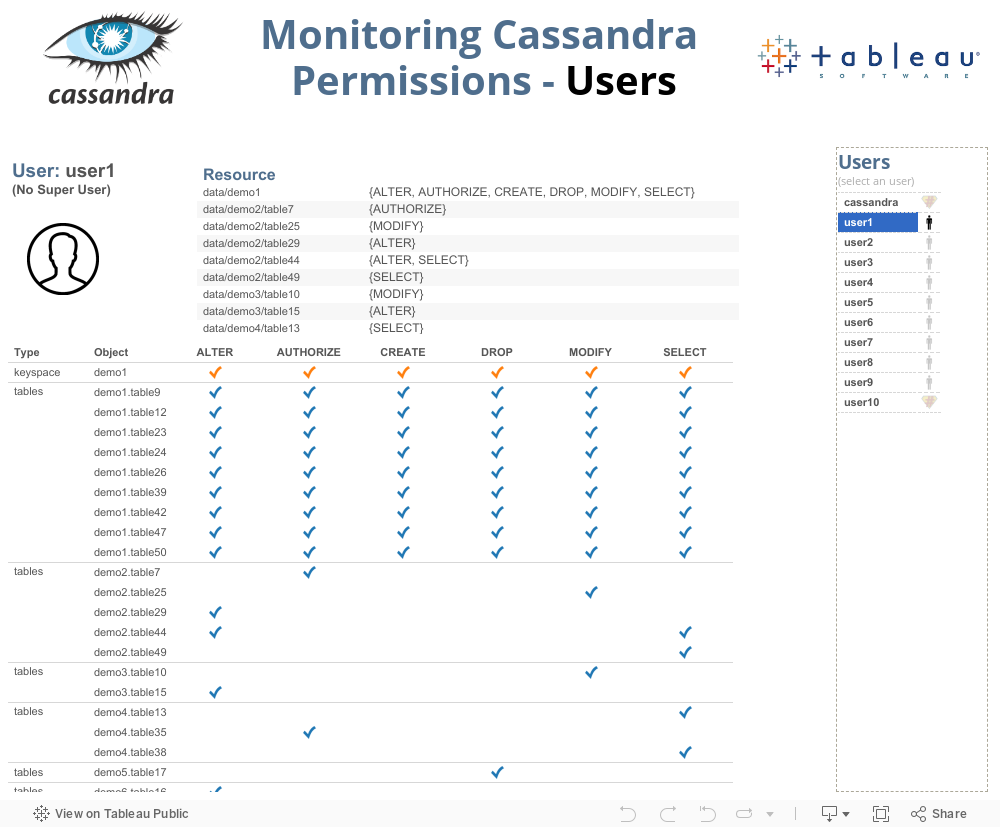
For instance, the user1 has access to which table?
It is clearly obviously for the administrator that user1 has access to the keyspace demo1 and all its tables. But it may not be so obviously for everyone.
Those kind of analysis will be even more needed when using role-based permissions, which will add more complexity to monitor the permissions.
One advantage of using the ODBC driver is the possibility to access relative small tables and convert the raw data into visual forms.
As you can see below, using Tableau to access the small permissions tables gives you much more visual information and make it much easier to monitoring the permissions.
Example #1 - What are the user1 permissions?

Example #2 - Who has access to keyspace demo2 and its tables?

The query to achieve that resultset is not so trivial but isn't too complex:
SELECT
"permissions"."object" as "object_permissions",
"users"."name",
"permissions"."resource",
"users"."super",
"permissions"."grant",
"permissions"."type",
CASE WHEN "tables"."keyspace_name" ||'.'|| "columnfamily_name" IS NULL
THEN "permissions"."object"
ELSE "tables"."keyspace_name" ||'.'|| "columnfamily_name"
END
AS "object"
FROM
"system_auth"."users" "users"
LEFT JOIN
(
SELECT
(
CASE WHEN ("permissions"."resource" <> '') THEN
{fn REPLACE(
CASE WHEN ({fn LENGTH("permissions"."resource")} - 5) >= 0 THEN
{fn RIGHT("permissions"."resource",({fn LENGTH("permissions"."resource")} - 5))}
ELSE NULL
END,'/','.')
}
ELSE NULL
END
) AS "object",
"permissions"."resource" AS "resource",
"permissions"."username" AS "username",
"permissions"."permissions_value" as "grant",
'tables' as "type"
FROM
"system_auth"."permissions_vt_permissions" "permissions"
UNION ALL
SELECT
(
CASE WHEN ("permissions"."resource" <> '') THEN
{fn REPLACE(
CASE WHEN ({fn LENGTH("permissions"."resource")} - 5) >= 0 THEN
{fn RIGHT("permissions"."resource",({fn LENGTH("permissions"."resource")} - 5))}
ELSE NULL
END,'/','.')
}
ELSE NULL
END
) AS "object",
"permissions"."resource" AS "resource",
"permissions"."username" AS "username",
"permissions"."permissions_value" as "grant",
'keyspace' as "type"
FROM
"system_auth"."permissions_vt_permissions" "permissions"
WHERE
{fn LOCATE('/',
{fn RIGHT("permissions"."resource",({fn LENGTH("permissions"."resource")} - 5))}
)} = 0
) "permissions"
ON ("users"."name" = "permissions"."username")
LEFT JOIN "system"."schema_columnfamilies" "tables"
ON
(
(
"tables"."keyspace_name" ||'.'|| "columnfamily_name" = "permissions"."object"
OR
"tables"."keyspace_name" = "permissions"."object"
)
and "permissions"."type" = 'tables'
)
WHERE
"users"."super" = 0
UNION ALL
SELECT
'super user' as "object_permissions",
"super_users"."name",
'super user' as "resource",
"super_users"."super",
"super_user_grants"."grant",
"super_users"."type",
"super_users"."object"
from
(
(
SELECT
'super user' as "object_permissions",
"users"."name",
'super user' "resource",
"users"."super",
'All' as "grant",
"type",
"object"
FROM
"system_auth"."users" "users"
LEFT JOIN
(
select
distinct "keyspace_name" as "object",
'keyspace' as "type"
from
"system"."schema_columnfamilies"
) "k"
ON (1=1)
where
"users"."super" = 1
UNION ALL
SELECT
'super user' as "object_permissions",
"users"."name",
'super user' "resource",
"users"."super",
'All' as "grant",
"type",
"object"
FROM
"system_auth"."users" "users"
LEFT JOIN
(
select
distinct "keyspace_name" || '.' || "columnfamily_name" AS "object",
'tables' as "type"
from
"system"."schema_columnfamilies"
) "k"
ON (1=1)
where
"users"."super" = 1
) "super_users"
INNER JOIN
(
SELECT 'ALTER' as "grant"
UNION ALL
SELECT 'AUTHORIZE'
UNION ALL
SELECT 'CREATE'
UNION ALL
SELECT 'DROP'
UNION ALL
SELECT 'MODIFY'
UNION ALL
SELECT 'SELECT'
) "super_user_grants"
on (1=1)
)
The idea of the query is:
1) expose all the access of the super users;
2) replicate the keyspace access to its tables.
After the query is done, all you need is to create your Tableau visualization:
domingo, 11 de outubro de 2015
3 things you should know when using the DataStax ODBC driver to connect Tableau with Apache Cassandra

This week we will talk about the great connectivity between Cassandra and Tableau.
As many of you already know, there is an ODBC driver that allows Tableau to connect with Cassandra.
The DataStax Developer Blog has a step-by-step instructions that will help you to use the ODBC driver with Tableau.
The intention of this blog is to highlight some details that I believe that are important.
Sometimes we are so exciting to be able to use Tableau to analise the data stored in Cassandra, that we may not remember some very important things:
#1 - Cassandra does not support aggregations (sum(), etc...)
That means that every query you perform against Cassandra, you will be asking for the detailed data. In other words, your queries will have similar behavior when you extract the data without using aggregation option (see the post Tableau Data Extract #1 - Aggregation), forcing your local machine to perform the aggregations.
So, imagine you have a Sales table where you keep all your sales data, and you want to analize your sales per date or per order.
CREATE TABLE demo.sales (
order_id int,
product_id int,
customer_id int,
order_date timestamp,
quantity int,
sales decimal,
PRIMARY KEY (order_id, product_id)
);
By default, Tableau will show you an aggregated chart:

In a relational database, the query would be:
select order_date, sum(sales)
from table
group by order_date
But in Cassandra, the query will not have the SUM:

Here is another example:

And the query is SELECT "order_id", "quantity" FROM "demo"."sales":

Now imagine if you are quering against a real world sales table, with millions or maybe billions of records. You will retrieve, to your local machine, all those billions of records,a dn will have to summarize them.
#2 - There is no joins inside Cassandra
We know that for many reasons Cassandra does not support joins, so if you are planning to perform some joins, your machine (desktop or notebook) will have to blend the data (see the post Data Blending #1).
So, you will ask Cassandra to retrieve all the records of both tables (or more), without aggregations, with all the columns you will use for the analises + the columns you will need for the join.
For instance, you have a sales table and a customer table, and you want to see the sales per customer's email.
CREATE TABLE demo.customer (
customer_id int PRIMARY KEY,
email text,
full_name text
);
CREATE TABLE demo.sales (
order_id int,
product_id int,
customer_id int,
order_date timestamp,
quantity int,
sales decimal,
PRIMARY KEY (order_id, product_id)
);
Your Tableau chart is something like this:

In a relational database, your query would be something like this:
select c.email, sum(s.sales)
from customer c, sales s
where c.customer_id = s.customer_id
group by c.email
But, again, Cassandra does not support neither joins or aggregations.
So, you will perform 2 queries:
1) SELECT "customer_id", "sales" FROM "demo"."sales"
2) SELECT "customer_id", "email" FROM "demo"."customer"

And you will have to do the aggregation and the join (data blending) local in your machine.
In those examples we used a table with 10 records, but again, in a real world your table may have billions of records.
#3 - You can not use any field you want to filter
Well, it depends on your understanding of "can" and "can not".
Because in practice, you can. Tableau will performance a select field1, fieldN from table and will apply your filter after retrieve the data. So, you "can" filter any field you want to, but keep in mind you will retrieve all the data frrm the table, and will have to filter in you local machine.
But if you filter only one value of the primary key (primary key field = <value>) then Tableau will ask Cassandra for that specific value:
SELECT "customer_id", "email", "full_name"
FROM "demo"."customer"
WHERE ( "customer_id" = 20 )
ALLOW FILTERING
Be aware of the "allow filtering".
For each primary key column that you filter more than one value, that column will be removed from the where condition.
For instance, if you filter Order id (partition key) = 1 and product id (clustering column) = 100, then the query will be:
SELECT "order_id", "product_id", "customer_id" FROM "demo"."sales" WHERE ( "order_id" = 1 ) AND ( "product_id" = 100 ) ALLOW FILTERING
You also can use >=, <=. > and < to filter the clustering columns:
SELECT "order_id", "product_id", "customer_id" FROM "demo"."sales" WHERE ( "order_id" = 1 ) AND ( "product_id" >= 100 ) ALLOW FILTERING
In other words, when you follow Cassandra's filtering rules, you will be just fine.
But if you try Order id (partition key) = 1 and product id (clustering column) in (100,200) then the query will be:
SELECT "order_id", "product_id", "customer_id" FROM "demo"."sales" WHERE ( "order_id" = 1 ) ALLOW FILTERING
But if you try Order id (partition key) = 1 and product id (clustering column) in (100,200) then the query will be:
SELECT "order_id", "product_id", "customer_id" FROM "demo"."sales" WHERE ( "order_id" = 1 ) ALLOW FILTERING
However, if use any other field (even though to filter only one value), Tableau will ask Cassandra for the detailed data (select field1, fieldN from table) without the where condition.
Also, if you create a quick filter, first Tableau will ask Cassandra for all the values of that field.
For instance, if you create a quick filter for the the email field, this is the query that Tableau will perform to populate the quick filter:
SELECT "email" FROM "demo"."customer"
If you were using a relational database, the query would looks like this:
SELECT distinct "email" FROM "demo"."customer"
What about the secondary indexes? Well, if you use them to filter (only one value) they will be used on the where condition, but they are dangerous: avoid them.
So, the more appropriate title for this topic would be "you shouldn't use any field you want to filter".
Coclusion
When planning to use the ODBC driver to connect Tableau to Cassandra, be aware of all those points.
Try to use aggregated tables instead of detailed tables. Aggregated tables can be created by your application or thought Spark.
You also can use Spark SQL connector if you have a Cassandra+Spark cluster or the Hive connector as well.
If you have any suggestion or comments, please feel free to post here.
terça-feira, 24 de março de 2015
Enhance your chart label

By default Tableau gives you some options to decide when to show the mark label: All, Min/Max, Selected, Highlighted or Line Ends (for the line chart).
What if you want to have different options, such as "Max & Line Start" or "Min & Line Ends"?
To achieve that you need to create a calculated field to be used in the mark label:
IF
<CONDIDITON>
THEN
<VALUE TO SHOW>
END
The <CONDITION> will depends of what you wanna show:
//SHOW MAX VALUE
(WINDOW_MAX(SUM([Sales])) = SUM([Sales]))
//SHOW MIN VALUE
(WINDOW_MIN(SUM([Sales])) = SUM([Sales]))
//SHOW LINE STARTS
FIRST() = 0
//SHOW LINE ENDS
LAST() = 0
You can also mix those conditions.
For instance, you wanna show the Max & Line Starts as we said before:
IF
//SHOW MAX VALUE
(WINDOW_MAX(SUM([Sales])) = SUM([Sales]))
//SHOW LINE STARTS
OR FIRST() = 0
THEN
SUM([Sales])
END

You can also use that logic to color your chart. Just need to change the calculation to boolean.
For instance, you wanna color with orange the Min & Line Ends:
//SHOW MAX VALUE
(WINDOW_MIN(SUM([Sales])) = SUM([Sales]))
//SHOW LINE ENDS
OR LAST() = 0

You may use parameters to add interactivity (click on the image to be directed to Tableau Public):

5 things that can help your Analytics & BI iniciative

#1 - Understand your data environment
Take a few minutes to understand your data model and what your environment is capable of.
You dont want to end-up waiting your visualization to query a table with billions of rows in a environment that will takes hours to return.
#2 - Analytics tools does not make miracle (yet...)
Most recent analytics tools have a lot of capabilities, numerous charts and so on.
Although they can't guess what is your mind, they are here to help you!
So, if it seems too complicated to materialize in a visualization what you have in mind, try to start from a simple one and use the power of the tool to improve it until it looks like you had in mind.
And be aware: each tool has its particularity: in one tool the chart may be green and in the other it is blue.
Be ready to adapt as much as possible.
#3 - Share your expectation with the appropriate people
Is your visualization slow? Did you check your generated query? Does the IT, which created your data environment, knows how you planned to use the data and your performance expectation?
Sometimes you may want to have results in a few seconds and the IT thinks minutes are fine. So, talk to them.
#4 - Use the best of what you have and add value
Self-service data preparation tools are meant to prepare your data.
Data visualization tools are good in display data and enhanced insights.
Do not try to invert the roles.
If more than one tool is needed to do the whole job, mix the tools and use the best of each one.
In other words, create synergy with your tools.
In other words, create synergy with your tools.
#5 - Think out of box and have a open mind
Working a long time with the same tool or visualization may lead you to miss great insights and opportunities.
Try to do the things in differents ways and do not be chained to the same work method.
There is always a new technology that will helps you. So, don't be afraid to check what's new.
Assinar:
Postagens (Atom)